Visualizing Daily Caloric Intake
Posted on Wed 18 September 2013 in misc
After much data collection and munging, I'm proud to present this graph of my strange eating habits for July 2013.
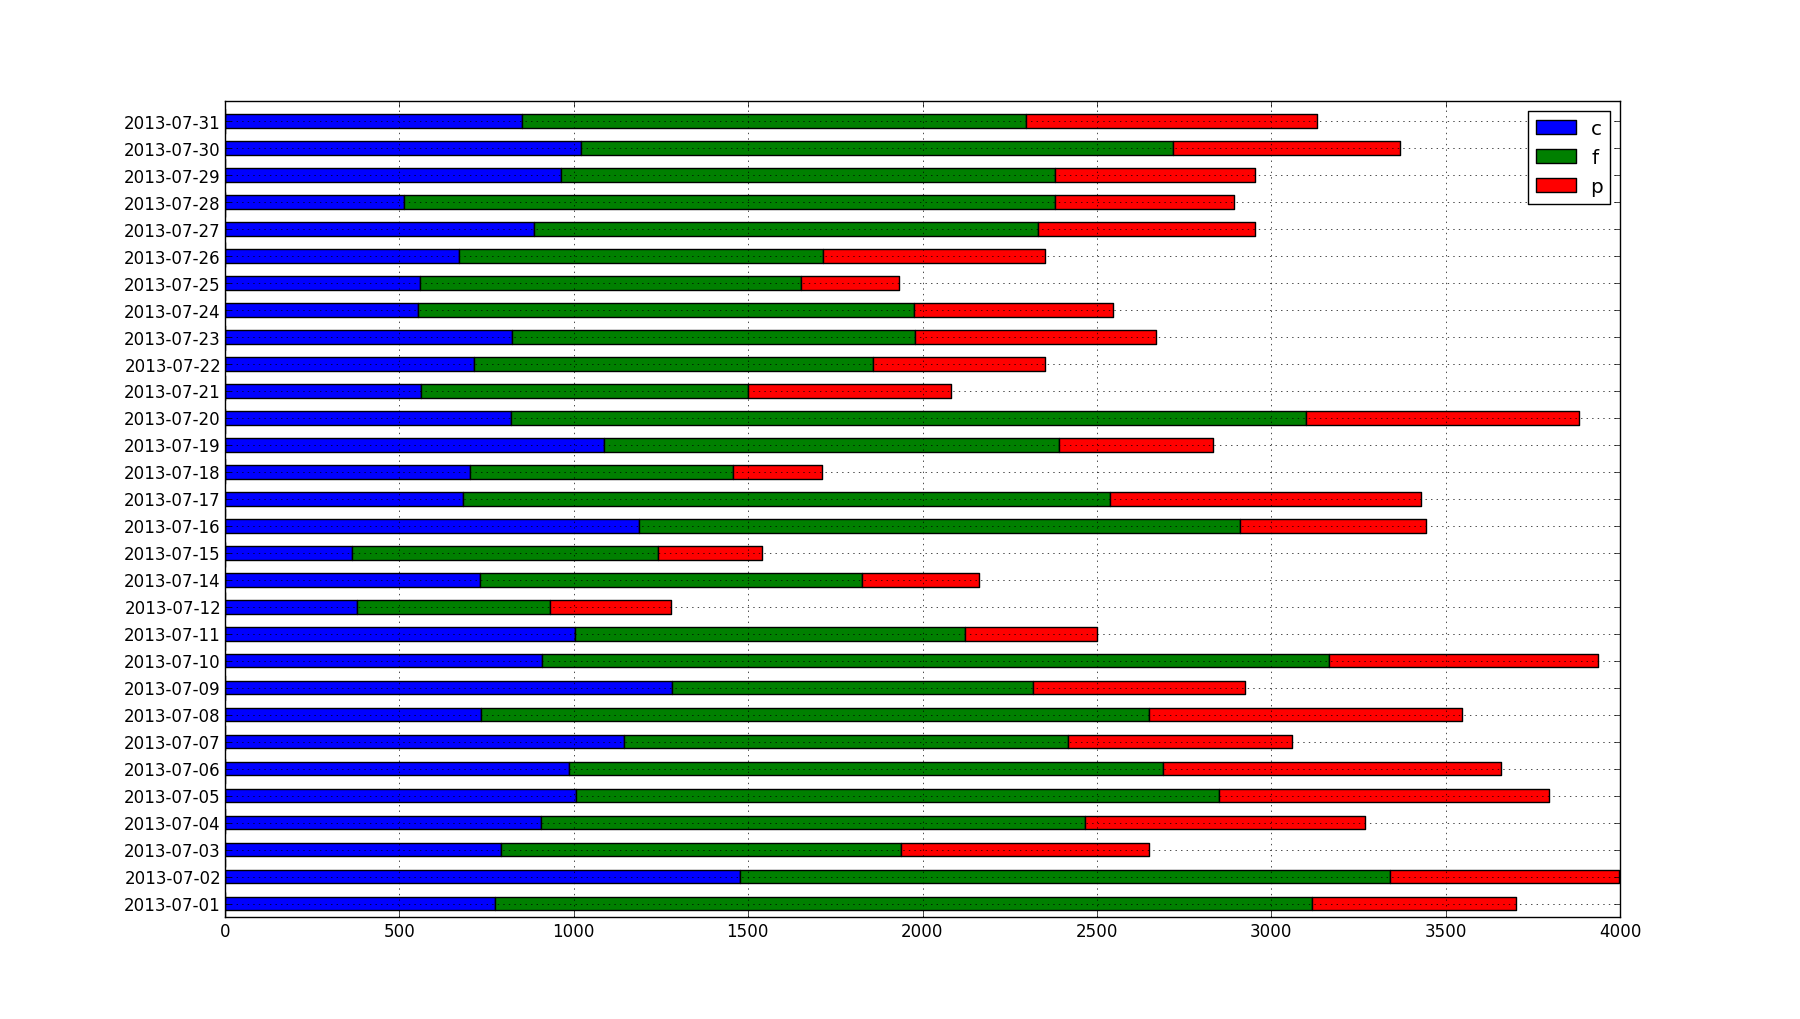 This breaks down my caloric consumption for each day by carbohydrates (blue), fat (green), and protein (red). I have data from March 2013 through August 2013, but I chose to drill down on just July. In this month, I'd been experimenting with high-fat, low-carbohydrate/ketogenic diets for about 12 months and meticulously logging my food consumption, among other things. By July, the experiment was over and I'd begun to consciously increase my carbohydrate intake, so it should look a little more "balanced" than prior low-carb months.
Here are some of my observations using python's 'pandas' library:
# 'd' is a pandas.DataFrame of Calories by Carbs,Fat,Protein

print(d)
# 2013-07-01 773.4620 2344.1805 583.7460
# 2013-07-02 1477.0428 1862.5788 656.9180
# 2013-07-03 791.2992 1145.7504 712.7120
# 2013-07-04 907.0984 1559.7909 801.1384
# 2013-07-05 1006.6896 1843.2441 947.5256
# 2013-07-06 986.8680 1703.7360 967.3420
# 2013-07-07 1143.6960 1274.3370 641.9880
# 2013-07-08 732.8176 1916.7201 896.9908
# 2013-07-09 1281.9548 1033.5897 607.8372
# 2013-07-10 910.2628 2255.0328 772.5288
# 2013-07-11 1004.7800 1116.3654 380.2240
# 2013-07-12 377.8120 552.9510 347.5000
# 2013-07-14 730.3320 1097.0370 335.5200
# 2013-07-15 363.4920 878.4405 297.7760
# 2013-07-16 1185.7132 1724.7879 533.2016
# 2013-07-17 683.2420 1853.9460 891.6680
# 2013-07-18 701.2500 755.7300 255.1960
# 2013-07-19 1086.4212 1304.2854 443.5876
# 2013-07-20 820.5680 2279.5200 781.1020
# 2013-07-21 562.9880 935.3340 582.4880
# 2013-07-22 713.1772 1146.1482 491.8272
# 2013-07-23 822.6144 1156.8348 690.3592
# 2013-07-24 553.5544 1421.2611 570.9420
# 2013-07-25 558.5900 1093.3965 282.0560
# 2013-07-26 671.7104 1042.0452 636.4024
# 2013-07-27 885.8336 1445.3289 622.4760
# 2013-07-28 511.8304 1867.7844 512.1832
# 2013-07-29 963.0200 1416.5055 572.4840
# 2013-07-30 1019.4208 1697.9346 650.9468
# 2013-07-31 850.8284 1446.4989 832.9432
One of the first things I was curious to investigate was my macronutrient ratios.
# Total monthly Calories of [Carb, Fat, Protein]
totalc = map( lambda k: int(pandas.np.sum(d[k])), d.keys())

# Daily average in grams
totalc[0] / 4 / len(d) # 4 Calories per gram of carbohydrate
totalc[1] / 9 / len(d) # 9 Calories per gram of fat
totalc[2] / 4 / len(d) # 4 Calories per gram of protein
# 208g Carb
# 159g Fat
# 152g Protein
# 208g Carbohydrate

# Ratios
map( lambda nut: float(nut)/pandas.np.sum(totalc), totalc)
# 29% Carbohydrate
# 50% Fat
# 21% Protein
First, but not most surprisingly, I'm eating many more carbohydrates (208g) than my previously ketogenic diet would permit. With that said, I've had plenty of energy. I've been weightlifting regularly (July was a very consistent month) and as I've increased my carbohydrates and decreased my fat, I've been steadily gaining muscle as well as fat.
Second, I manage to eat a staggering amount of fat! When I was tracking my food, I was concerned my fat intake would appear low because of how difficult it is to track cooking oil consumption--not so, apparently. With 50% of my Calories coming from fat (predominantly monounsaturated and saturated, I'll bet), I'm well above the USDA's upper-recommendations of 30%, which makes me quite the deviant.
Third, I have been shooting for 150-200g protein per day. I'm just barely meeting my goal at 150g. This is a little annoying to me, but it looks to be low because of the occasional low-protein day. July was a great month for muscle gain, so I can't complain too much. This data is missing several foods that I had issues tracking (protein powder) because they weren't in the easy database.
pandas.np.sum(totalc) / len(d)
# 2884
Lastly, my caloric intake is all over the place. 2880 Calories is roughly the intake I've been shooting for to gain muscle and maintain fat, but my lowest-Calorie day is about 1/3 my highest-Calorie day. This may be due to a data error ... I'll have to investigate later.
As for the data I've been collecting, this is the tip of the iceberg. In the future I plan on looking at how my macronutrient ratios have changed month-to-month, what I eat, what kinds of vitamins/minerals I get, my meal frequency, and many more fun observations.